Sensor Data Templates
The Sensor Data Template (a CSV file)
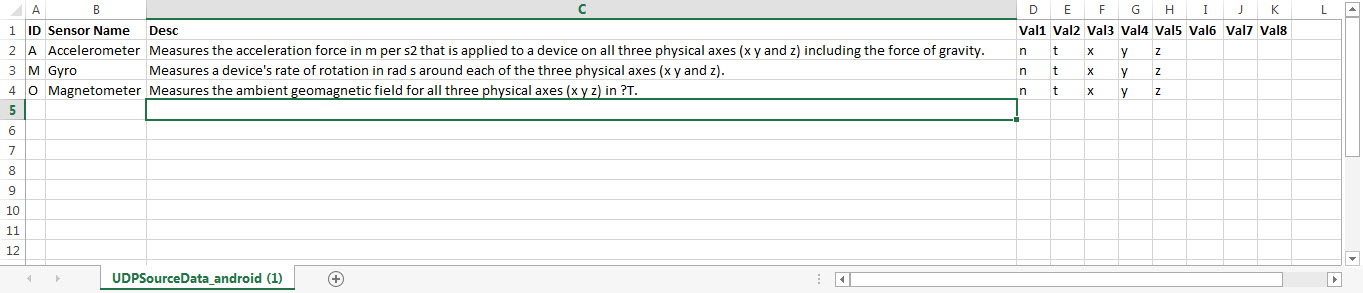
A sensor data template is simply a CSV file that contains a list of all sensors that provide data from this source. Below is a UDP source that has only 3 sensors, which is actually the sensor data template used for the Android project you have likely seen in certain RealTime demo videos.
As you can see from the screenshot below, each row of the file represents an individual sensor. Each column in the row provides required information about the data that sensor provides. The actual data elements of the sensor have names. Those names are placed in the columns "Val1 - Val8". In some cases a sensor may only have 1 data element, or perhaps 3.
The templates allow up to 8 data member elements for each sensor. Simply leave the columns empty if there is no data. You can easily create these for each of your data source types. See the descriptions of each of the 11 columns of data found in this file.
Key Elements of the CSV Sensor Data Template (by Column):
ID Column: This is the unique identifier for an individual sensor that will be providing data from this source. This ID is what is used to identify the datagram source during parsing of the incoming data in RealTime. CSV files always assume that the source sensor ID is a text character (string identifier).
Sensor Name Column: The Sensor Name is not used in the parsing, but is used when displaying data from the sensor in a visual component in the RealTime work space. For instance, if you have chosen a circular gauge for this sensor data to be displayed, the sensor name will be shown in the drop down box during the data assignment process. In some cases, the visual control element will automatically display the name of the sensor to further clarify the source.
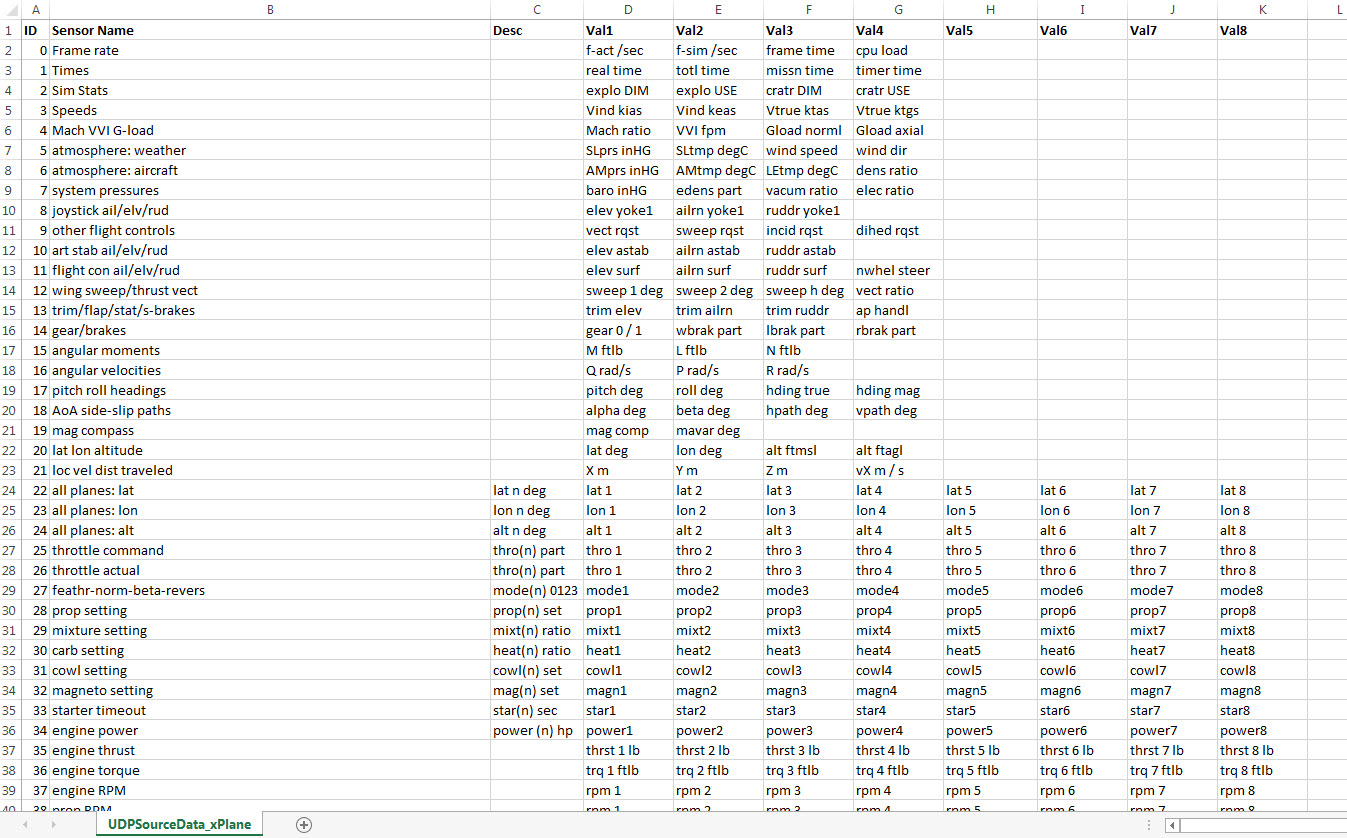
Description (Desc) Column: The description column holds information that you believe is useful or helpful in remembering anything you need to know about this sensor. This column is largely for your convenience. It is quite helpful to have a description when your data source has 10's or hundreds of sensors. A good example of how helpful a description is would be the X-Plane data template with 134 sensors - each with 3-8 data elements. Without descriptions, it would be difficult remembering the significance and differentiation of each of those 134 sensors when attempting to build a meaningful visual display and/or selecting the most appropriate data sensor for display.
Val1, Val2, Val3, thru Val8 Columns: These columns are the names of the specific data members of a sensor. The name of the column at the top (Val1 thru Val8) never changes, but the names that you put in those columns at that row for the sensor, represent the elements of the sensor. For instance, the accelerometer of the Android device provides 5 values - the sample number (n), the time in milliseconds of the sample (t), the force in each of the component axes (x, y and z). Each of these sensor data items will be shown in the selection process when adding visual controls to the screen.
How to Import a Sensor Data Template
Importing the template is done after a UDP data source has been created. Simple select Add UDP Source from the ribbon bar, and specify the basic parameters of the incoming data in that source. Once created, then select "Import Sensor Template" and select the CSV file you created. Once this is done, simply drop visual components on to the work area, double click or right click on a component, and make the 3 selections to populate data into that source: Select the UDP source, Select the sensor, and then select the individual data member element of that data source sensor. Select OK, and you should have visual display of your data. Always remember to click the small green radar icons at the center top of the work area to start and stop the live updates of your data in the display.