Getting Started
The RealTime Interface
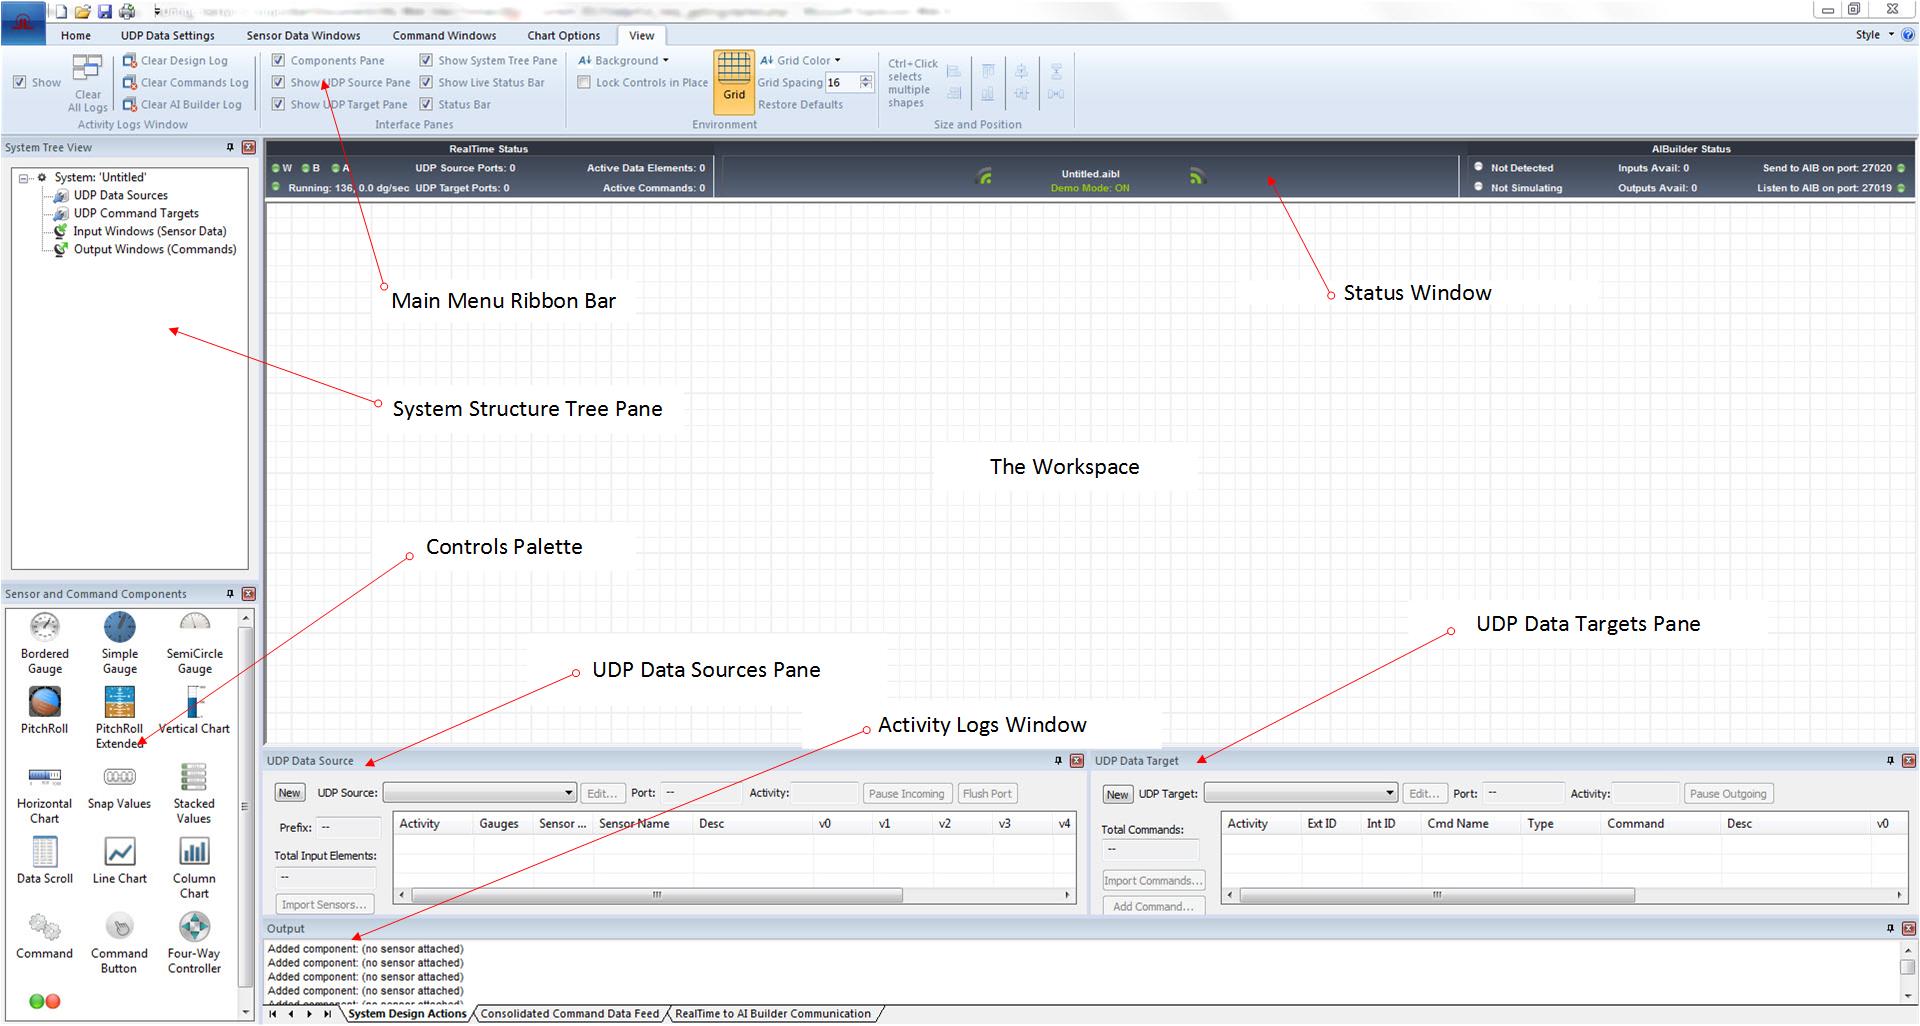
The first step in getting started with TinMan RealTime, is getting to know your way around the interface. Let's start off with a screenshot below of a typical layout, and each key pane labeled. Below the screenshot, we will discuss each element.
Key Elements of the RealTime Interface
Main Menu Ribbon Bar: Category based structure of commands. Click on the tab of interest to present features and options of the desired functionality. The ribbon bar will automatically select the tab for you as you toggle selection of various controls placed in the workspace. Hover over any of the elements of the ribbon bar to see a tooltip with helpful hints and/or text related to that item.
System Structure Tree Pane: A tree based view of all components of the current project. Major categories of the tree structure are UDP Sources, UDP Targets, Input Windows and Output Windows. Each of these types of system item are explained elsewhere. Each category will build its sub branches as you design your desired system. As sensor inputs are established to input windows, and as commands are attached to output windows, the associated item in the system tree will create and expand its sub branches. This is a useful way to quickly navigate larger systems and to ascertain which of the controls is enabled with sensor input or command output.
Controls Palette: This pane holds symbolic icons representing each of the 16 types of controls available for you to add to your system. Each of these items is explained in the next help section. By left-clicking on a control icon and holding the button while you drag, you may place the control anywhere in the workspace. Once placed, the control takes its full size and populates all relevant items with temporary text and or data. You may instantly view the primary functionality of input window controls by running RealTime in Demo Mode as described below. This will supply the control a steady stream of periodic data such that visual functionality can be observed. Once your project is complete, and anytime before then, this palette, along with any others can be hidden or made visible by clicking the ribbon bar category View, and then checking or unchecking the box associated with the pane.
UDP Sources Pane: This pane provides quick complete viewing access to all loaded sensor templates of the selected UDP Source. TinMan RealTime allows any number of UDP Sources to operate (be listened to) simultaneously, and each UDP Source can have an unlimited number of sensor data templates. Each sensor data template is either created using the sensor data template Wizard, or imported in bulk using a CSV file. Select the current UDP Source for viewing by clicking the drop down combo box at the top of the pane. Each sensor data template occupies a row in the visible associated spreadsheet in the main part of the window, and is a parsing prescription and labeling source for input windows to draw data from. You will notice that the far left column of each of the sensors in the rows is either dark gray or light blue, depending on whether data is found arriving from this source is from that sensor. In addition, a datagram rate (UDP Rate) is provided giving a rough sense of how many datagrams per second are arriving for this sensor.
UDP Targets Pane: This pane provides quick complete viewing access to all loaded commands of the selected UDP Target. TinMan RealTime allows any number of UDP Targets to operate (send data to) simultaneously, and each UDP Target can have an unlimited number of commands. Each command is either created in the create command Wizard, or imported via CSV file. Select the current UDP Target for viewing by clicking the drop down combo box at the top of the pane. Each command occupies a row in the spreadsheet in the main part of the window, and is a text reprentation of the actual UDP command that will be sent by any output control that is associated with this command.
The Workspace: The workspace is where the input windows and output windows are placed. You can add, modify, edit or delete any controls along with moving and arranging as desired. The print area can be printed as well.
Status Window: The status window provides three general sections of information. The left most section contains indicator lights relevant to RealTime sockets activity, including the number of UDP sources and targets, along with total number of active input and output windows. The three indicator lights in the upper left corner are: W for Windows Sockets initialization, B for appropriate socket binding, and A for asynchronous listening capability on the primary port for syncing with TinMan AI Builder (if you have it). The center section provides radar icons that illuminate green when RealTime is in full operation - listening, sending and updating the screen for control updates. You may click either radar icon to toggle this mode. The center area also provides the name of the current project file, and beneath that name is the Demo Mode ON or OFF indicator text. This text may be clicked directly as well to toggle the demo mode functionality, which is more fully described below.
Activity Logs Window: The activity logs window provides information and feedback from the RealTime environment as you build, modify and run your system. This is not where active sensor input or command output is provided. These windows exist in the workspace area and are updated much more frequently. There are 3 sub-panes within this pane and each are labeled descriptively. Hide or show this pane like the others, through navigating to the View Category on the main Ribbon Bar and checking or unchecking the associated control - Activity Logs Window.
What is Demo Mode?
Demo mode simulates the receipt of external data to input windows (controls that receive data) that are not yet connected to a sensor data template source. In other words, if you want to see the funcitonality of a control before you have your data sources connected to it, simply drag the control to the screen, and run it in Demo Mode. Do this by clicking one of the radar symbols in the Status Window, and clicking the Demo Mode text beneath the project name in between the two radar symbols.